Cairo people flow data transformation and visualization
Background:
Most datasets have a certain location aspect, either a physical address or an IP address that identifies a location or maybe coordinates directly. Mining location data require in most cases an integration of additional supportive dataset and in most cases visualizing. Visualizing location data is an art.
Objective
Transforming Text-based origin-destination matrix (OD) with the support of additional open-source geospatial data to extract new insights that were impossible to retrieve from the original data.
Original Text-based OD matrix contains trip starting zone, arrival zone, departure time, and arrival time. We transform each trip to Spatio-Temporal locations called people to flow using Openstreet maps and Costumed land-use map to be able to mine more details. Details are as flows:
(1) Input data processing
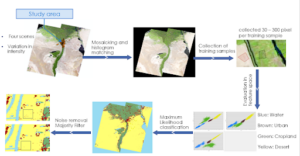
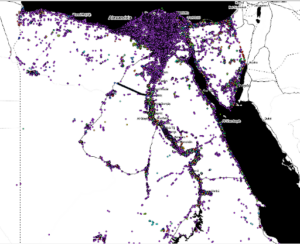
FIGURE 1 CUSTOMIZED LANDUSE CLASSIFICATION FOR THE STUDY AREA FROM LANDSAT SATELLITE IMAGES INTO 4 CLASSES, URBAN, CROPLAND, DESERT, AND WATER.
LANDUSE DATA IS USED FOR GEOSMOOTHING
FIGURE 2 COUNTRY LEVEL ROAD NETWORK EXTRACTION FROM OPENSTREETMAPS (OSM). OSM IS ASSESSED TO REMOVE DISCONNECTED LINKS
(2) Work Flow
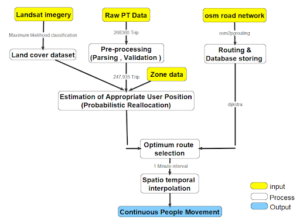
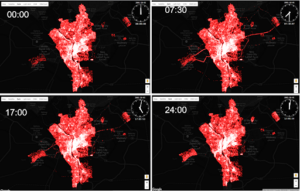
FIGURE 3 WORKFLOW
(3) Output and visualization
FIGURE 4 SNAPSHOT OF PEOPLE FLOW VISUALIZATION WITH TIME. NOTE HOW IT’S EASY TO ANALYZE POPULATION DENSITY FROM THIS VISUAL SNAPSHOT
FIGURE 5 VIDEO SHOWING THE FLOW.
(4) Data mining for new insights
This transformation results in high temporal resolution mobility which can give very important information. Most importantly, The Spatio-Temporal distribution of the population in the city. This means, now we not only can answer [Who is where and when?] but [How many people are expected to be in a specific place in a specific time of the day] example [how many people are expected to be at Odaiba at 3 pm on a normal weekday? This is priceless information for outdoor advertisement and traffic control
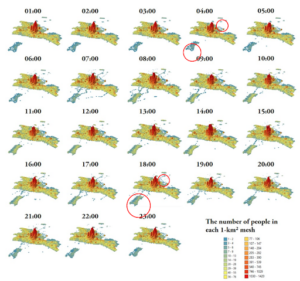
FIGURE 6 SPATIO-TEMPORAL DISTRIBUTION OF POPULATION. NOTICE HOW POPULATION DENSITY CHANGE ALONG THE DAY IN AREAS MAKED WITH RED CIRCLE
THOSE AREAS ARE INDUSTERIAL CITIES SO ITS POPULATED ONLY DURING THE DAY WHEN PEOPLE WORK THERE
Skills needed to finish this work