

From an Airplane Arrival at Narita Airport to Luggage Claim
By: Mohamed Batran

Batran: Hi Omar, my flight is arriving at Narita Airport at 17:30, can you pick me up?
Omar: Sure, happy to! When should I pick you up?
Batran: Wait! There are lots of COVID-19 measures and I heard we need to get tested upon arrival and that might take time.
Omar: That’s right, but you know it is quite challenging to wait at the airport so we want to estimate if you land at 17:30 – when do you expect to reach the luggage claim
Batran: Can’t find much on the internet? If only someone has measured that time.
Covid-19 has introduced many changes to the travel industry. It has also added more complexity to the already existing ones during the airport process from landing to luggage claim.
A few of those changes are:
– Showing a negative PCR certificate
– Getting your temperature tested
– Getting a saliva test and waiting for the result
– Filling in many documents and consents
– Installing and configuring a health monitoring app
With that much complexity, scheduling a pickup service or setting up any time dependant commitment is challenging. In this short article, we show data-driven visual analysis on the operation flow and the time it takes from flight landing to luggage claim in Narita Airport.
—-
Data
Mobile phone data is one of the best ways to understand and measure the timing of the processes in different places. Most mobile phones collect user location data to provide a better service to users and they often allow users to access their data or request a copy.
Once we landed at Narita Airport, we were connected to the internet and the GPS locations started being recorded. On average one point was collected every 5 seconds. By looking at the sequence of points over time, it is quite easy to see visually where I was at which time and draw a quick conclusion on the overall distance or the total time traveled.
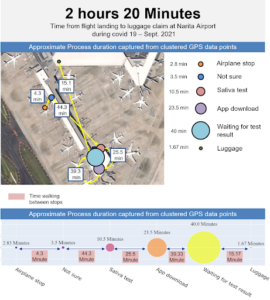
It took us 2 hours and 20 minutes from flight landing time to submitting the customs declaration form and exiting the airport.
Downsampling the data points
To reduce the complexity and see the data trends more clearly such as the stops where points accumulate. Let us reduce the number of points to be one point every 10 seconds instead of one point every 5 seconds. This process is called subsampling and it’s highly used in time-series analytics.

Now that the data has been downsampled, we want to only extract the stopping points. Stopping points indicate an activity, for example when you wait in a line to take the saliva test or when you wait to collect the luggage. When someone stops in the same location, the GPS data points keep accumulating at the same point where it is easy to detect a trend.

Detecting the walking points through speed
To capture those stops, we first need to remove the points where we were walking or running. To do that we can calculate the speed of each point by comparing it to the point before. The average human walking speed is about 1.4 meters per second. For me I was walking with my 2 years old daughter, so the speed was barely 1 meter per second, this is in the velocity_mps, which refers to meter per second.

Next, all we have to do is drop the data points with a speed that equals to or more than the average walking speed. Since my walking speed was quite low in the first place, what has been removed are high-speed points and the points when the plane was landing and moving. However with regular walking speed. Expect better results.

Finding the stops by clustering
Clustering is a technique for finding common data points, Spatiotemporal density-based clustering or STDBSCAN is an unsupervised machine learning algorithm to cluster the points that are close in space and time which can represent a potential stop. Once we run the model on the data point and adjust the parameters. We can extract relevant points that represent the stops where the movement was relatively still as below.

Every stop represents an activity or something that describes why did we stop in the first place. In most cases, we can map a stop to a shop nearby or a restaurant and so on. But in this case, it is specific to the operation so we can label those points manually. After all, they are only a few clusters.

Measuring the time it takes for every stop
How long does it take for every process? If we look at every GPS cluster point, we can simply find the point with the minimum time and the point with the maximum time in each cluster. This will represent the start of the stop and the end of the stop. The difference between both is the duration of the stop. In the table below the duration of every cluster represent how long It took us to finish each process. We were quite relaxed and had no reason to rush and we had kids too. So the time for a single person in a run might be lower.


Estimating the walking time in the Airport
Walking time is the time between the different stops, this is an important part of characterizing mobility patterns. How long does it take to walk from a place to another? To calculate that from the data, the walking time can be the time between the last point of a stop and the first point of the next stop. The table below list the time spent in nonstops, this include time hanging around or going back and forth looking for the next stop or when the kids peak from the glass to look at the airplanes. Which was quite often. The time walking might be exaggerated though when some points falsely are not calculated as being part of a cluster or when a small stop is being neglected. Such as stopping by the restroom.
Detecting the approximate location of the stop
Finding the approximate location of the stop can sometimes be important. When a stop happens GPS locations scatter around one point. This is because the accuracy of the GPS is usually around 4 meters in mobile phones. To find an approximation of the stop point, we can look at each GPS point cluster and estimate the location of the centroid of the cluster.

Final results

Conclusion
- It takes about 2 hours and 30 minutes from flight landing to luggage claim and customs clearance.
- Waiting for saliva test results takes most of the waiting time followed by app download and installation confirmation by the airport staff.
- Walking from the airplane to the saliva test location took most of the time
- Luggage claim was quite fast as there are very few people using Narita Airport at the moment
Business opportunities for this / similar analysis
Measuring processes time and customer journey can reflect the efficiency of those processes and introduce enhancements based on data to keep enhancing the operation in an iterative process (Kaizen). The ubiquity and availability of mobile phone data have introduced an amble of opportunities to understand user journeys in the offline world and the efficiency of the operation provided for those customers. There are multiple sides of introducing data-driven performance monitoring products:
Data collection
Data collection poses a challenge as it requires user consent in order for their data to be collected. Offering a service such as an app dedicated to the facility or free wifi where a customer will agree to provide their data with a promise to keep it anonymized and secure is one way of collecting such data. Another route is using data aggregator companies or companies that operate mobile phone apps at a large scale and having a business partnership or data-sharing agreements.
Data representativeness
The collected data will always represent a sample. After all not all people will install the app or use the free wifi. Even partnering with mobile phone app companies will also only offer a fraction of all visitors. This is usually acceptable in the standards of data processing when calculating aggregated insights. In addition, a suitable scaling factor can be calculated to have representative insights.
Privacy
I’m comfortable showing you where I have been on a map. But most people will not be happy knowing this much information about their mobility is being extracted and tied to their identity. In addition, regulations are getting strict over time. To maintain a good standard for privacy, there are many steps to follow such as:
Anonymization
The data coming from users should not be traced back to their identity. This needs appropriate private information hashing in a non reversed ways such as SHA-2 or other more complex hashing that can not be reverse-engineered.
Aggregation
Calculated insights on an individual level should be aggregated to show an overall trend or a business intelligence dashboard from the aggregated product. For example, saying users named kyle, mark, and Omar has stayed in this process for 15 minutes is not a good strategy. we can instead extract the average time staying in this facility is 15 minutes +- 3 minutes after aggregation.
Access control
Minimizing the number of administrators or data users is best practice when ensuring only relevant people access this information.
Artificial intelligence Integration
Artificial Intelligence can predict or classify an unknown event. It can also forecast a future outlook or demand and support simulations for operation enhancement. Using AI along with the previous analysis can be in many forms such as:
-
Prediction
- Prediction how long will the processor each subprocess will take in the future
- Predicting how much time will it take for different types of people (e.g. passengers with kids, single passengers, airport staff)
- Predicting what the change in the time be if an enhancement to the operation is introduced
-
Classification
- Classifying each service counter in terms of efficiency
- Classifying passengers in terms of their waiting time
Final notes
Data-driven operation enhancement is no longer just proof of concept work. It has already been introduced at scale in many businesses and for many applications. The ability to start data collection in a way that preserves data privacy standards will be key in what future data-driven technology adoption an entity can embrace.
Having said that, The applications for understanding service time and customer journey can be applied to many facilities and many industries. For example,
- Shopping malls
- To dynamically price different areas of the mall-based on the demand
- To extract insights about the difference in behavior between weekday and weekend and holidays for better allocation of security personnel
- Factories
- Understand the time it takes for each process for operation enhancement
- Find out unused spaces or facilities by drawing a heat map utilization
- Manage personnel safety when an emergency happens by knowing where each person is
- Airports
- Better understand peak hours and the change of service time on different days and weekend
- Allocate more human or less human resources by forecasting the demand on different days and different areas
- Smart city and residential compounds
- Understand the movement pattern of residence for better designing a customized service
- Understand road utilization density and factors that inro ranking roads based on importance to allocate better maintenance strategy
- More and much more applications
About me
Mohamed Batran is an Artificial Intelligence specialist and a data monetization specialist working in Japan. Throughout his career, he worked in data from industries such as finance, e-commerce, logistics, telecom, transportation in designing data utilization to increase revenue, cut down costs or improve customer satisfaction.